Interactive Maps
developed to share data for various NCSG projects and allow clients to perform simple analyses
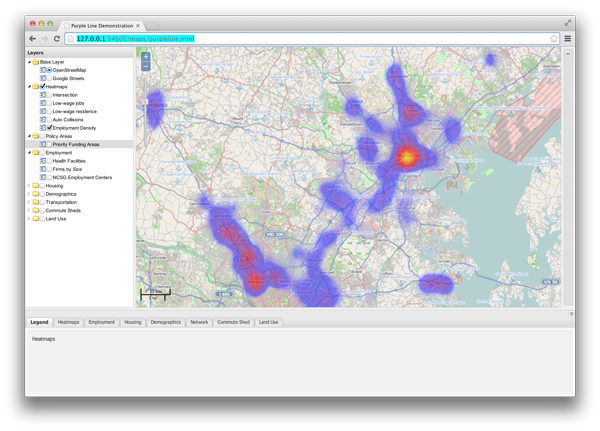
The interface and controls are the same for most maps
Clicking a link will take you to a full-page application, centered on the project's study area. Choose a combination of analysis layers from any or all of the categories on the lefthand side. Then, change the opacity of each category using the sliders in each of the tabs along the bottom
Note: These underlying code for these maps is changed relatively often, and I occasionally shut down my map servers. It is possible that some (or all) layers will fail to load for short periods of time. If you have questions about a particular map/layer/dataset etc., email me
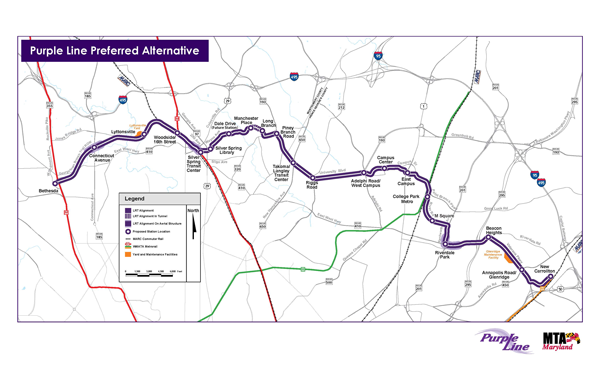
Purple Line Corridor Coalition data and analytical support
Donec ullamcorper nulla non metus auctor fringilla. Vestibulum id ligula porta felis euismod semper. Praesent commodo cursus magna, vel scelerisque nisl consectetur. Fusce dapibus, tellus ac cursus commodo.
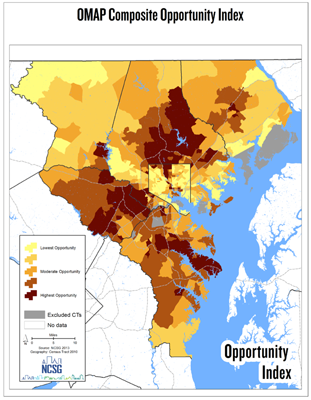
Opportunity Mapping for the Baltimore Region
Donec ullamcorper nulla non metus auctor fringilla. Vestibulum id ligula porta felis euismod semper. Praesent commodo cursus magna, vel scelerisque nisl consectetur. Fusce dapibus, tellus ac cursus commodo.
Maryland Placetypes demonstration
Donec ullamcorper nulla non metus auctor fringilla. Vestibulum id ligula porta felis euismod semper. Praesent commodo cursus magna, vel scelerisque nisl consectetur. Fusce dapibus, tellus ac cursus commodo.